Web
-using IceFaces 1.8.2 (JSF 1.2)
<ice:form id="chartPopUp">
<ice:panelPopup draggable="true" modal="true" rendered="#{activeBackingBean.chartPopUpVisible}">
   <f:facet name="header">
      <table width="100%">
         <tr>
            <td>
               <ice:outputText value="Grafički prikaz" />
            </td>
            <td align="right">
<ice:commandButton id="closeOdabirButton" styleClass="xButton" actionListener="#{activeBackingBean.closeChartPopUpVisibleAction}" /> </td>
</tr>
</table>
</f:facet>
<f:facet name="body">
<ice:outputChart id="chart" type="pie2D" chartTitle="#{activeBackingBean.title}" colors="green, red" data="#{activeBackingBean.chartData}" labels="#{activeBackingBean.chartLabels}"/>
</f:facet>
</ice:panelPopup>
</ice:form>
BackingBean
private int totalOkDPTs;

private int totalNotOkDPTs;


public String getChartData()

{

 return totalOkDPTs + ", " + totalNotOkDPTs;

}

public String getTitle()


public String getChartLabels()
Result
Jasper report
- using iReport 3.6.2
Select colors:
Pie Chart - Properties - Series Colors ...
Data to display:
Right click Chart and select Chart Data - Details - Pie series
In this example I have 2 series
Parameters:
totalOkDPTsPercentage - String
totalNotOkDPTsPercentage - String
totalOkDPTsPercentageNumber - Double
totalNotOkDPTsPercentageNumber - Double
pieSeries definition:
keyExpression - what displays in bottom (bottom label)
valueExpression - used for calculating and displaying (Number)
labelExpression - label with arrow (String)
<chart isShowLegend="true">
<reportElement x="98" y="28" width="375" height="205"/>
<chartTitle>
<titleExpression><![CDATA["Grafički prikaz"]]></titleExpression>
</chartTitle>
<chartSubtitle/>
<chartLegend/>
</chart>
<pieDataset>
<pieSeries>
<keyExpression><![CDATA["Ispravnih DPK - " + $P{totalOkDPTsPercentageNumber} +"%"]]></keyExpression>
<valueExpression><![CDATA[$P{totalOkDPTsPercentageNumber}]]></valueExpression>
<labelExpression><![CDATA["Ispravnih DPK"]]></labelExpression>
</pieSeries>
<pieSeries>
<keyExpression><![CDATA["Pogrešnih DPK - " + $P{totalNotOkDPTsPercentageNumber} +"%"]]></keyExpression>
<valueExpression><![CDATA[$P{totalNotOkDPTsPercentageNumber}]]></valueExpression>
<labelExpression><![CDATA["Pogrešnih DPK"]]></labelExpression>
</pieSeries>
</pieDataset>
<piePlot>
<plot>
<seriesColor seriesOrder="0" color="#00FF33"/>
<seriesColor seriesOrder="1" color="#FF0033"/>
</plot>
<itemLabel color="#000000" backgroundColor="#FFFFFF"/>
</piePlot>
</pieChart>
Select colors:
Pie Chart - Properties - Series Colors ...
Data to display:
Right click Chart and select Chart Data - Details - Pie series
In this example I have 2 series
Parameters:
totalOkDPTsPercentage - String
totalNotOkDPTsPercentage - String
totalOkDPTsPercentageNumber - Double
totalNotOkDPTsPercentageNumber - Double
pieSeries definition:
keyExpression - what displays in bottom (bottom label)
valueExpression - used for calculating and displaying (Number)
labelExpression - label with arrow (String)
jrxml code:
<pieChart><chart isShowLegend="true">
<reportElement x="98" y="28" width="375" height="205"/>
<chartTitle>
<titleExpression><![CDATA["Grafički prikaz"]]></titleExpression>
</chartTitle>
<chartSubtitle/>
<chartLegend/>
</chart>
<pieDataset>
<pieSeries>
<keyExpression><![CDATA["Ispravnih DPK - " + $P{totalOkDPTsPercentageNumber} +"%"]]></keyExpression>
<valueExpression><![CDATA[$P{totalOkDPTsPercentageNumber}]]></valueExpression>
<labelExpression><![CDATA["Ispravnih DPK"]]></labelExpression>
</pieSeries>
<pieSeries>
<keyExpression><![CDATA["Pogrešnih DPK - " + $P{totalNotOkDPTsPercentageNumber} +"%"]]></keyExpression>
<valueExpression><![CDATA[$P{totalNotOkDPTsPercentageNumber}]]></valueExpression>
<labelExpression><![CDATA["Pogrešnih DPK"]]></labelExpression>
</pieSeries>
</pieDataset>
<piePlot>
<plot>
<seriesColor seriesOrder="0" color="#00FF33"/>
<seriesColor seriesOrder="1" color="#FF0033"/>
</plot>
<itemLabel color="#000000" backgroundColor="#FFFFFF"/>
</piePlot>
</pieChart>
Result
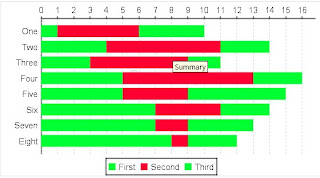
Stackedbar Chart
I have people and 2 values for them, OK and NOK
Result:
Add stackedbar chart:
- define series colors, Legend position
Define chart details:
- I have added 2 series since I have 2 values (OK and NOK)
- I have added 2 series since I have 2 values (OK and NOK)
The Series expression field is the name of the series. Its value can be any object that implements java.lang.Comparable. In most cases, the value of this field is a string. --OK
The Category expression field is the label of each value in the chart. The value of this field is typically a string. In our example, each state is a different category, so we will use the state field ($F{state}) as our category expression. --People's name
The Value expression field is a numeric value representing the value to be charted for a particular category. In our example, the number of aircraft in a particular state is the value we want to chart. Therefore, we use the implicit stateGroup_COUNT variable ($V{stateGroup_COUNT}) as our value expression. --OK in 1 serie and NOK in 2nd
The optional Label Expression field allows us to customize item labels in the chart.


No comments:
Post a Comment